Construction of my project
If you are interested how all of my work has been done, I encourage you to read this section.
1. NEOCITIES
First of all, I logged in and created my own site in neocities.org, an easy plataform to start working in a project like this. In a specific folder I modified the appearance of my website changing the code given. It's not requested to be an expert to build your own space.
2. MAPPER.JS
Mapper.js allows the creation of an interactive map. Below you have an image which show the programation code for its function.
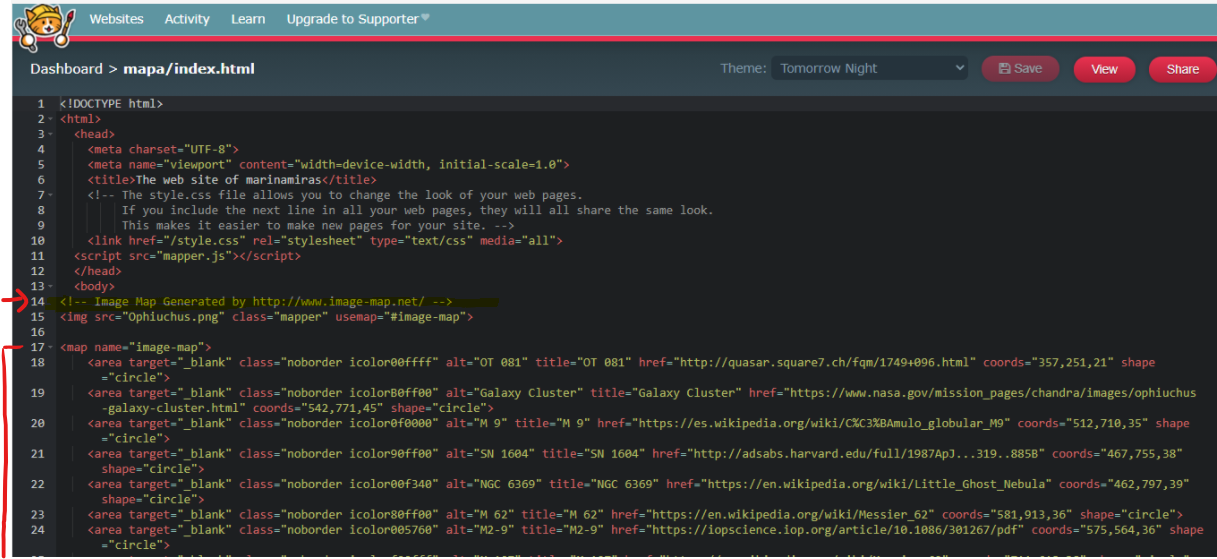
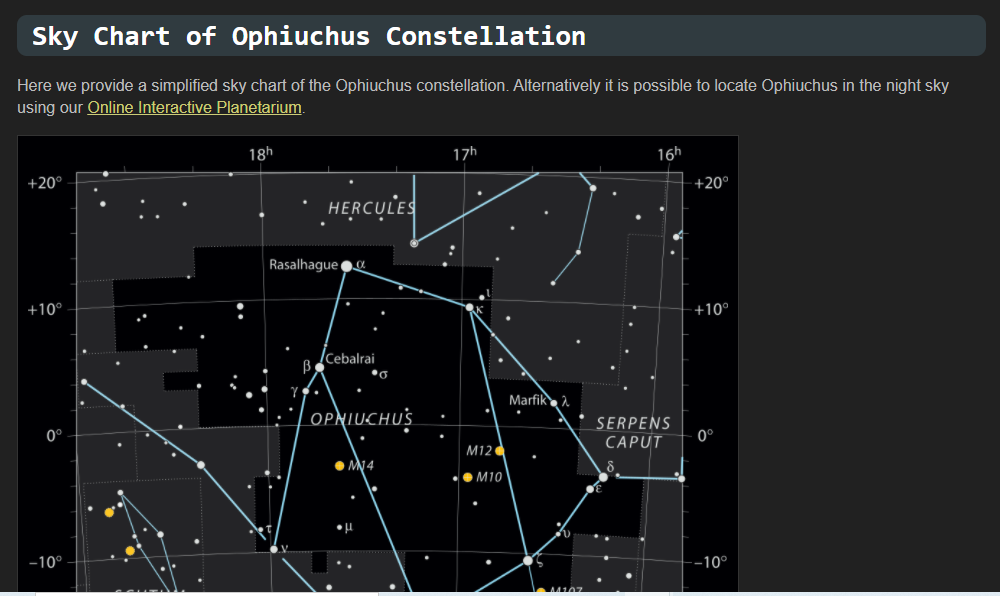
3. IMAGE MAP
Once you decided which part of the sky you're going to investigate, copy an image of the zone (I used theskylive.com) and paste it in image-map.net. There you'll be able to determinate which specific zones are important to your project, and you'll associate each point you selected to the link you've been working on (the site from you took the information, if it is the case).
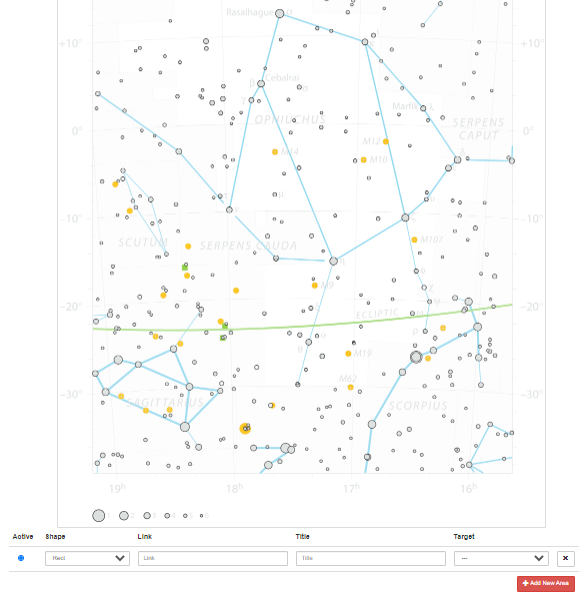
Now ask for a code and paste it in the folder that you created in neocities. It is possible to change the color of every interesting point, as I did. You only have to change the number of each point, determinating the color by a common color scale. Once you have finished, your site will have the appearence of the map you chose, and when you click on the different points, you'll be sent to the website you linked before.
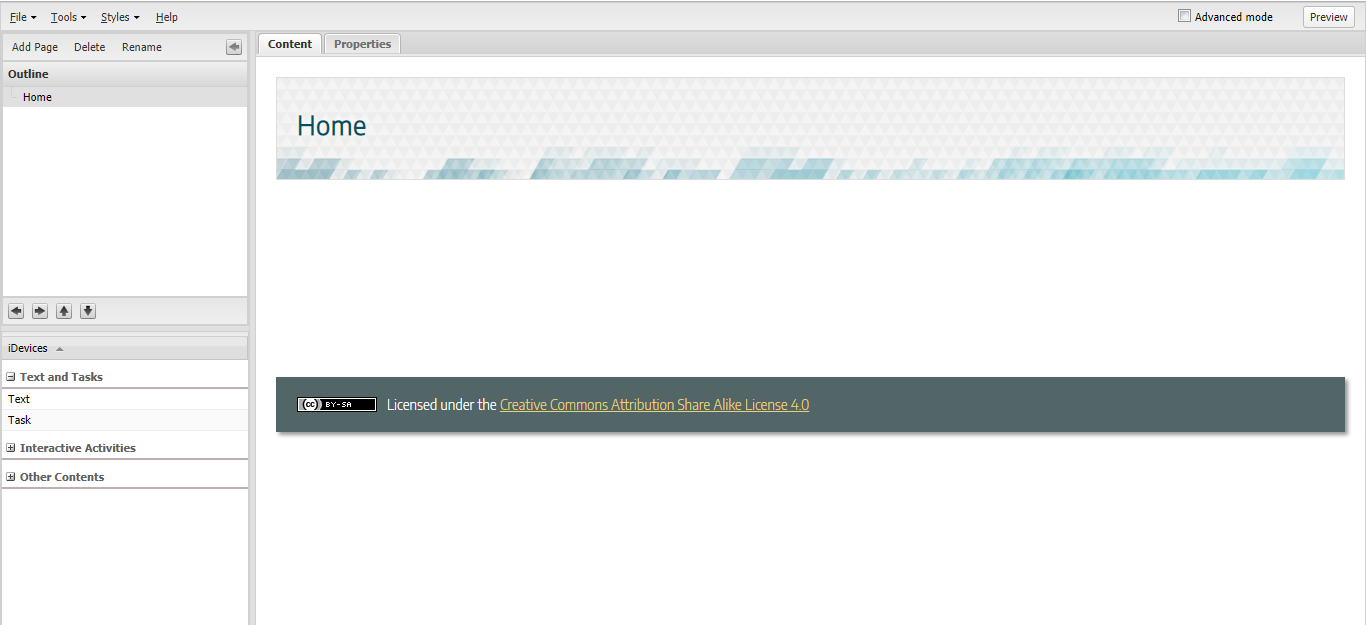
4. EXELEARNING
Exelearning is a perfect program to take to a better level your site. It is very easy to get through and has many options to carry out with your project.
First, you can do a plan of the estructure of the page. You can link your image map, so that when you click on there, you'll see it in exelearning. When you want to export your work (don't forget to save it) you just have to click on "file>export>website". There you'll have a new folder with all the information used, and what you'll have to do is select all data and paste it in your neocities site. Be carefull to not to insert the data in the folder of the map you created. You have to paste it out of the folder.
It might won't let you upload all data, but that's not a problem. Look for the specific problematic data and upload all the rest. Maybe there's more than just one wrong archive, just keep trying until it is done.
Now your website has the appearence of what you did in Exelearning.
5. CHANDRA
In my case, I needed to search for an image of every deep sky object I was investigating, and the spectra of each one, too. This is maybe the hardest or the most difficult step to do, but I'll explain how to do it clearly.
1.Search for cda.harvard.edu/pop/ , the intranet of Harvard.
2.Click on "Advanced Search".
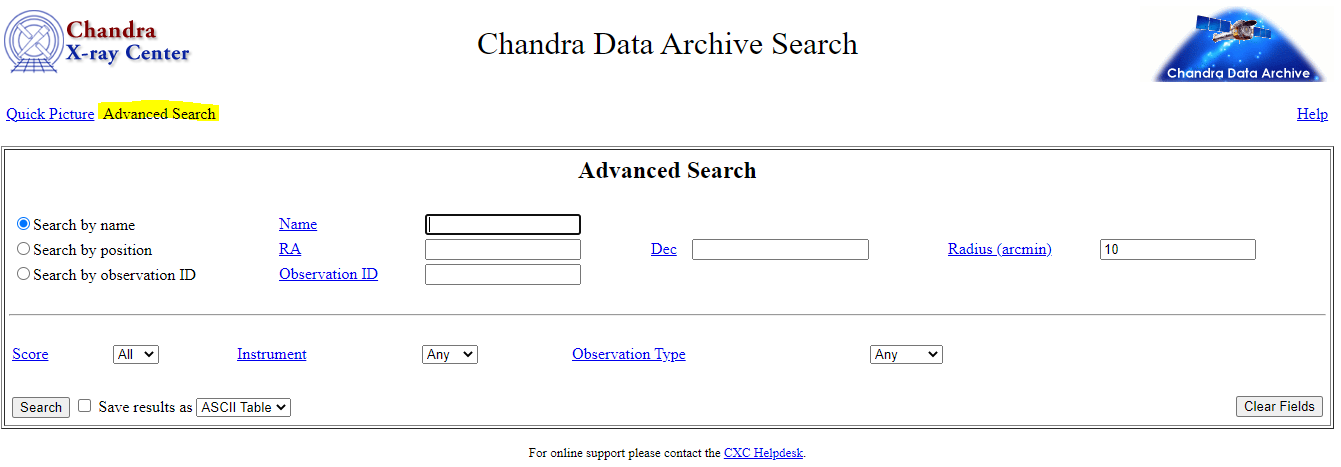
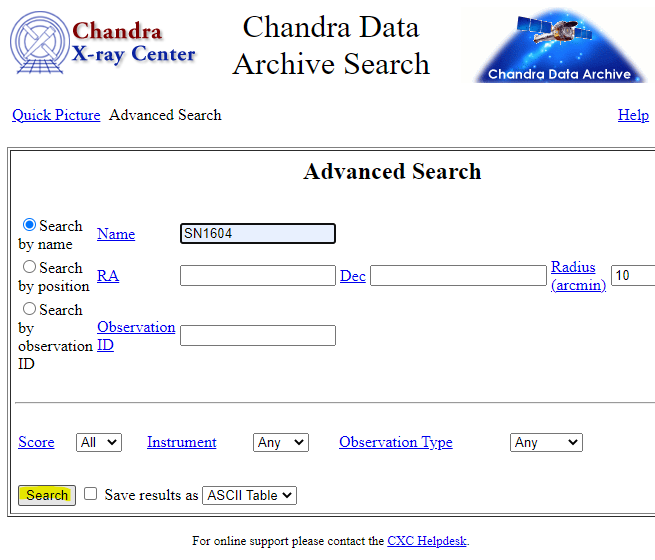
3.Write down the name of the object you are looking for (In Search by name)
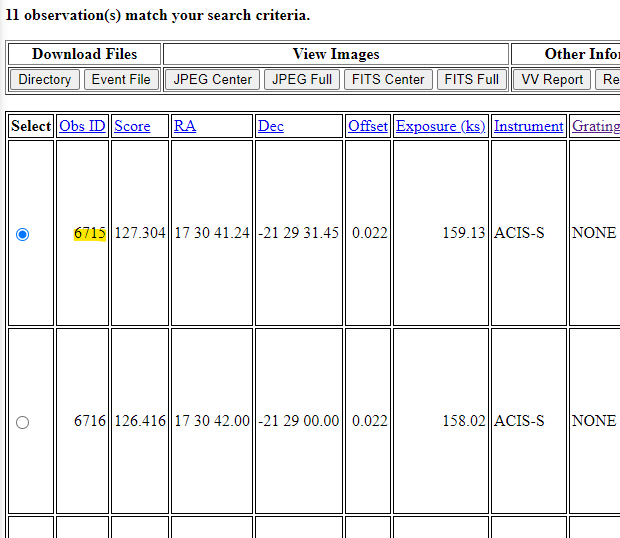
4. If there's any result to your search, copy the number of Obs ID (if there is more than just one, pick the one that you want).
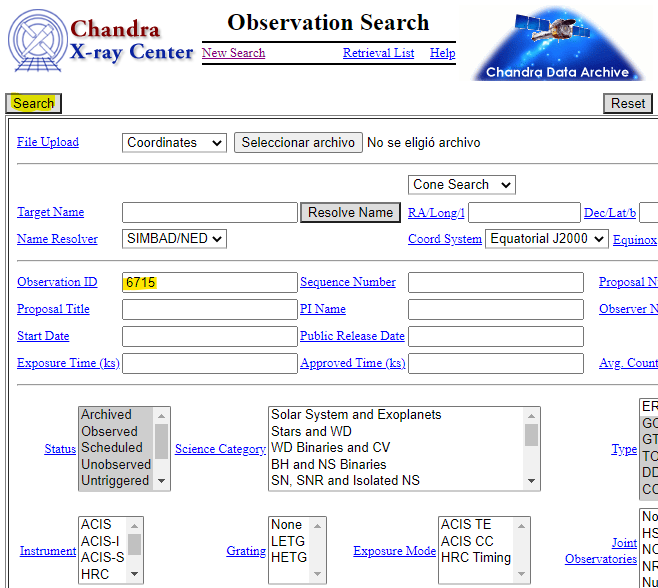
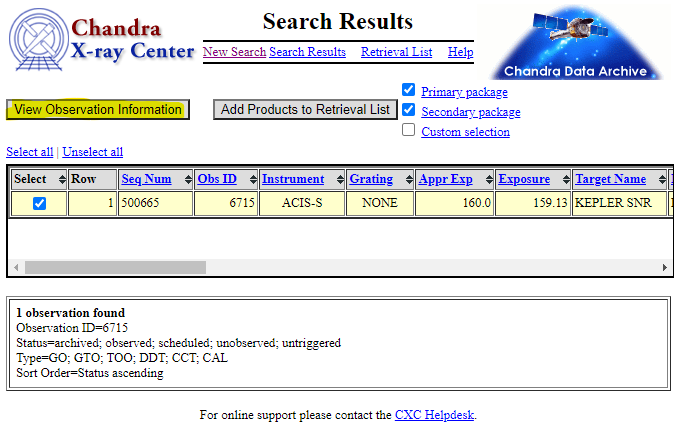
5. In another window, search for cda.harvard.edu/chaser/
6. Paste your number in "Observation ID", then, click on Search.
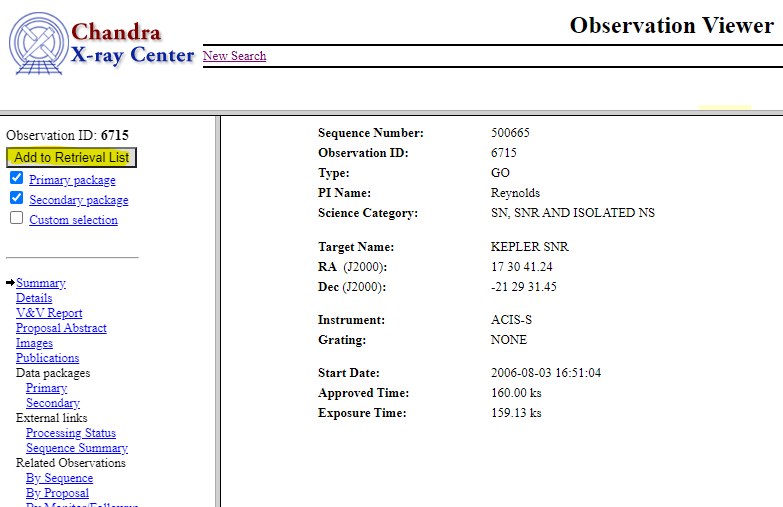
7. Click on "View Observation Information" on the top-right corner of the screen.
8. Click on "Add to Retrieval" on the top-right corner of the screen.
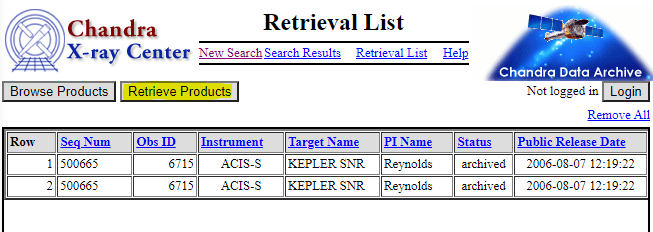
9. Click on "Retrieve Products"
10. Write down the gmail where you want to be notified. There is where all data will be sent to you. Then, click on "Notify Me".
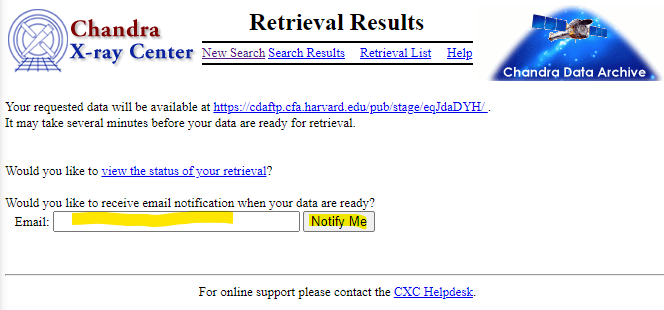
11. It may take a little to sent to you the data of your object.
12. Once you've recieved a gmail, click on the link in there.
13. Click again to the new link on screen.
14. Once you've downloaded all data, you'll have to decompress the package.
6. OPEN TAR ONLINE
I used ezyzip.com. You'll have to save only the archive which ends with "_evt2.fits.gz". Now you have the image of your object.
7. JS9 (CHANDRA)
In Js9.si.edu you'll be able to appreciate the image of your object, and most important, watch its spectra.
1. Open Js9 in a new window (search it in internet).
2. Click on "Flie>Open local"
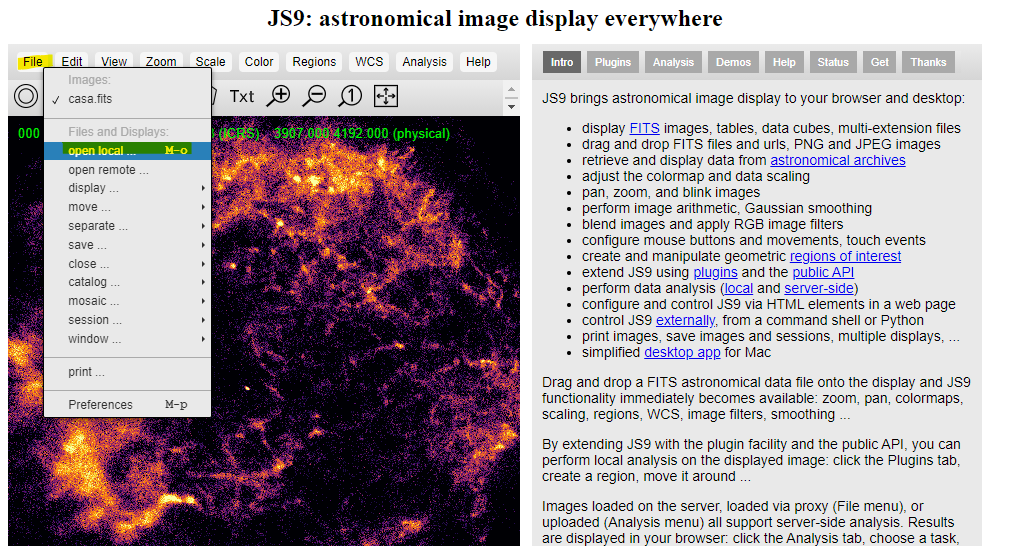
3. Select the archive "_evt2.fits.gz".
4. You'll then be able to see the image of you're object.
5. Click on "Analysis>upload FITS to make tasks avaliable".
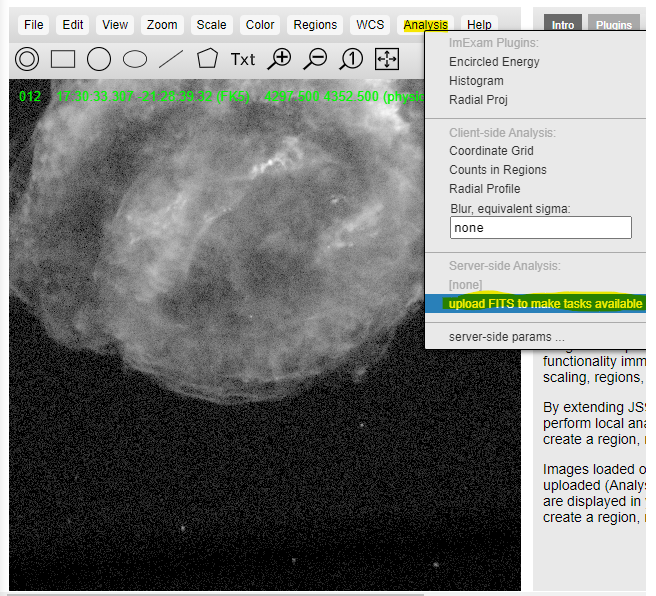
6. There will appeare a blue line. It will take a while until it's completely loaded.
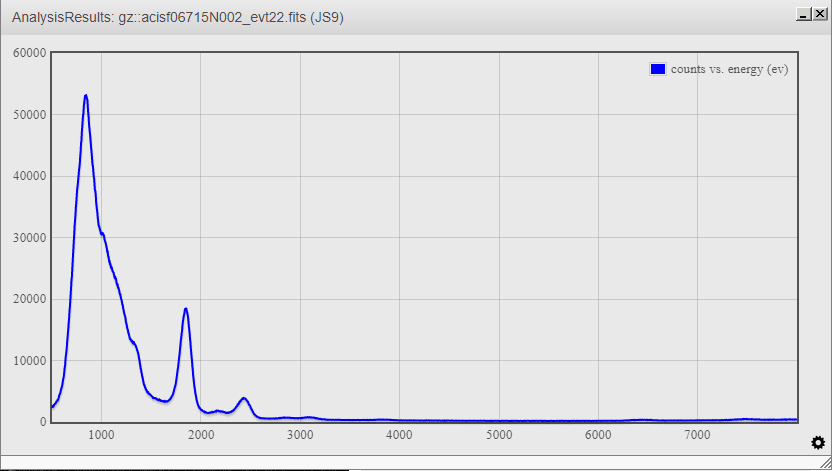
7. Click again on "Analysis" and then click on "Energy Spectrum".
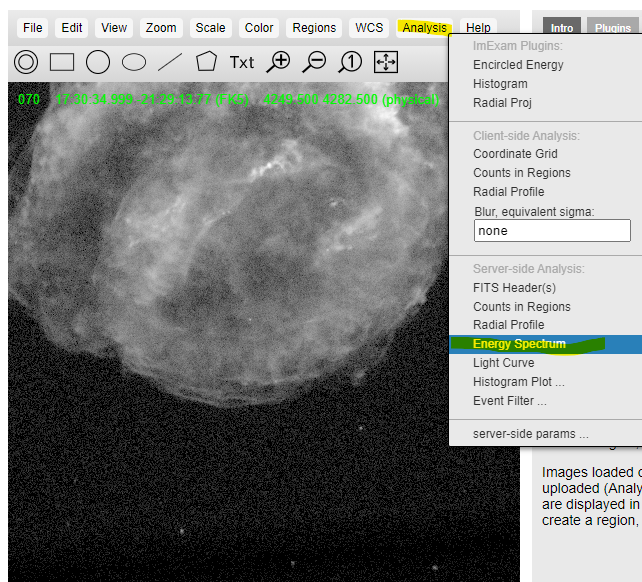
8. Finally you got the spectra of your object.
8. EXCEL AND R
Both programs are quite similar, but they are completely different, too.
As a pro, Excel has a simple interface that make tasks easier for us, but is not recommended when using it to manage databases. On one hand, Excel formats can give an error of compatibility problems with other similar programs, or even with other versions of Excel. On the other hand, it is very common Excel having problems with the formats of the variables we are working with (numbers & dates). Furthermore, Excel has a limited capacity of lines and columns in every calculation sheet.
Programming languages as it could be "R" are systems created and specially prepared for the management of large databases, even easily for the user who must see them. They have open source versiones wich allow you mold your work to your liking.
However, I used Excel because I didn't manage to use R at first. Eventually, I figured out that R was the best option I could have used, but I had already done my work.
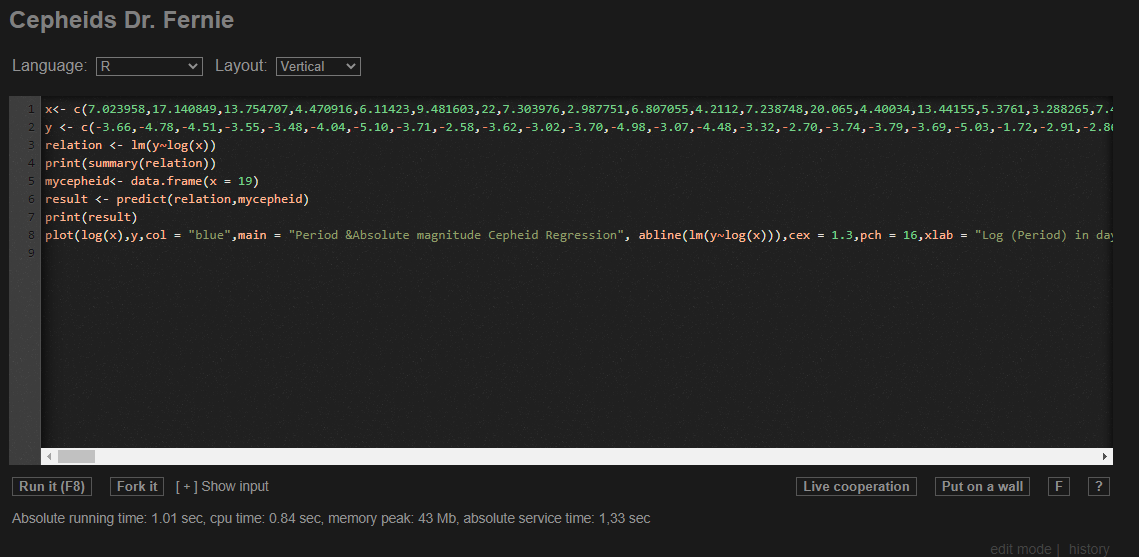
9. REXTESTER
When I wanted to make a graph with the data I found of my chepeids, I used Excel at first. In fact, it's very easy to use, like it would be done any other graphic. However, I was told to use R instead. Here is the link: https://rextester.com/XAKL30347
I only needed to write the first two lines (x and y) with the data I found, and it automatically made the graph. It is very simple and easy to use.
10. LABORATORY FOR THE STUDY OF EXOPLANETS
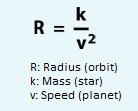
I used this web (https://www.cfa.harvard.edu/smgphp/otherworlds/ExoLab/lab/dataLab/data_lab.html) to learn how to figure out the radius of an exoplanet, through the transit method. This scientific method is ment to discover how large an exoplanet is (it is explained in the exoplanets section).
Once I logged in the Lab, I chose an avaliable exoplanet and picked up an hour. At that time, I was sent a picture of the exoplanet and its light curve. I was given a text where was explained how could I learn a lot of information just whatching at the graph. However, I needed to search for some data, as it could be the radius of the star, etc.
The site also gave me useful formula:
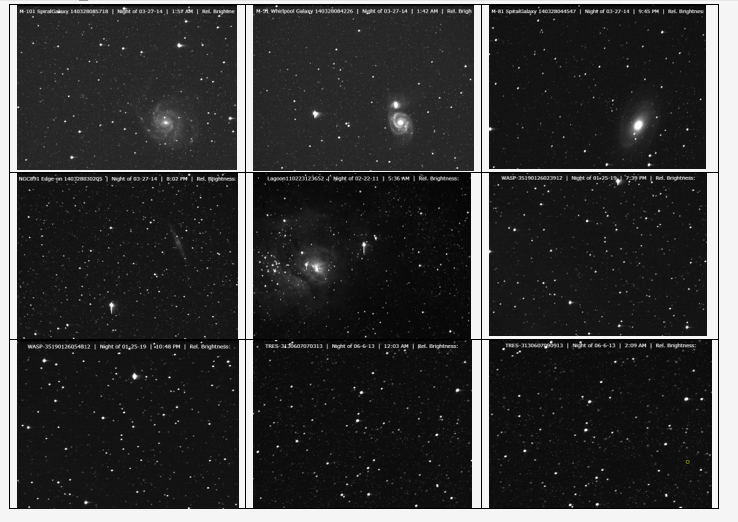
Later, I searched by my own another exoplanet (one in my constellation, Ophiuchus). I found GJ 3998, a star whose exoplanet was GJ 3998 b.
Here are some pitcures that the Laboratory For The Study of Exoplanets gave me:
11. THE ESA/ESO EXERCISE SERIES
This is the book I used to start learning about this subject. There is much information that I used to carry out with my project, as it could be some formula or methods that are explained in the book. Also, there are some exercices which helped me to understand what I was learning.
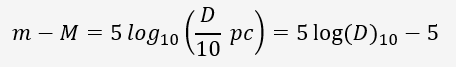
Apparent magnitude
The apparent magnitude (m) of a star is a measure of how bright a star appears as observed on near Earth. It is defined relative to the magnitude and intensity of a reference star. This meanss that an astronomer can measure the magnitudes of stars by comparing the measurements with some standard stars that have already been measured in an absolute (as opposed to relative) way. According to this, the apparent magnitude is given by:
![]()
Absolute magnitude
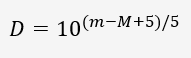
The absolute magnitude (M) of a star is defined as the relative magnitude a star would have if it were placed 10 parsecs from the Sun. Given the formula of the distance, I cleared M.
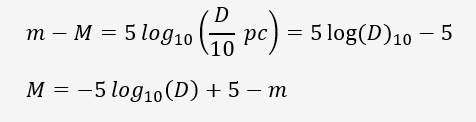
The distance equation
The equation below establishes the connection between the apparent magnitude (m), the absolute magnitude (M) and the distance (D), measured in parsec. The value m-M is known as the distance modulus and can be used to determine the distance to an object.
It is also seen like this:
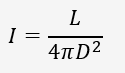
Luminosity and Intensity
Luminosity and magnitudes are related. A remote star with a hight luminosity can have the same apparent magnitude as a nearby stat with a low luminosity. Knowing the apparent magnitude and the distance of a star, we are able to determine its luminosity.
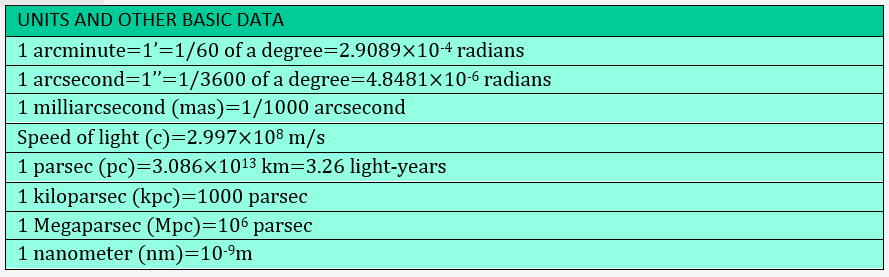
Mathematical Toolkit
12. CLASS
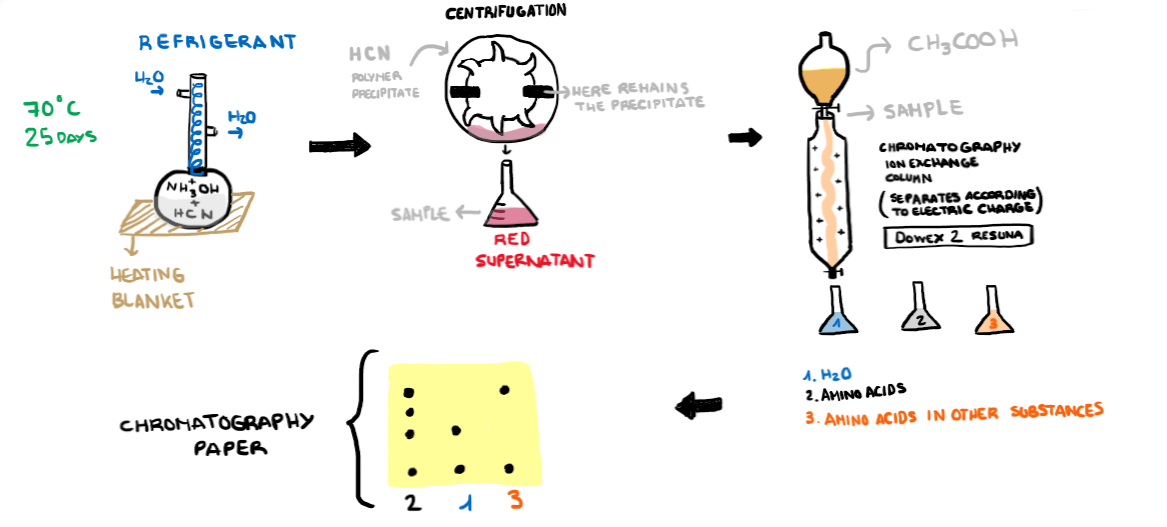
In class we had the opportunity of learning new methods that were used in science some time ago. For example, we red "A production of Amino Acids Under Possible Primitive Earth Conditions" and "A vacuum Microsublimation Apparatus" where we learnt about Cromatoghraphy (The paper chromathographic method).
We also learnt about Electroscopy.
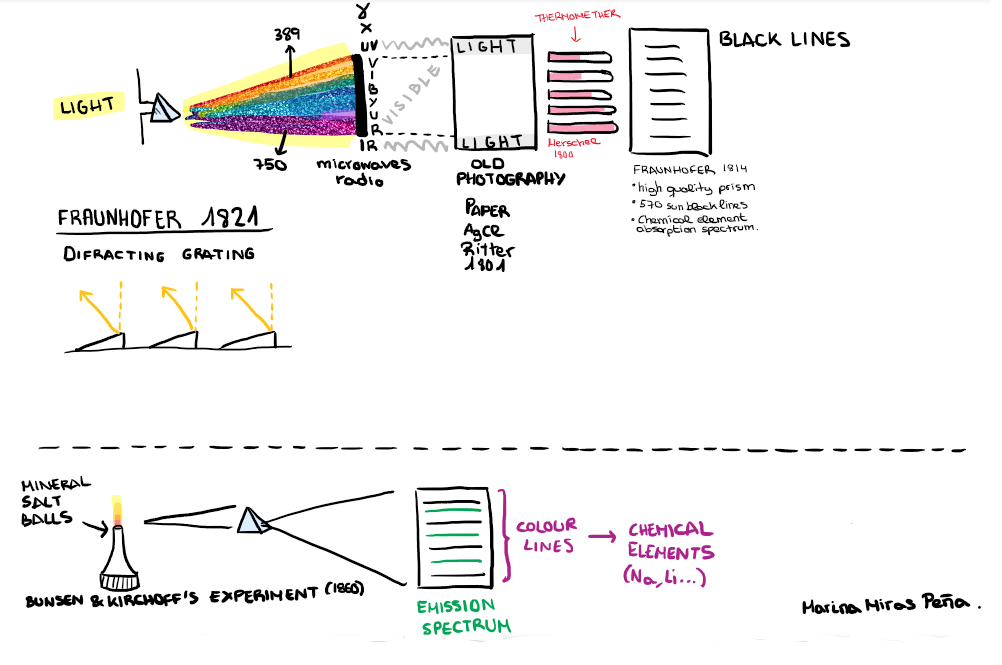
In this section we also talked about Beer (1852), who said that the concentration of a substance is prportional to the current technical basis absorption, SPECTRUMFOROMETRY.
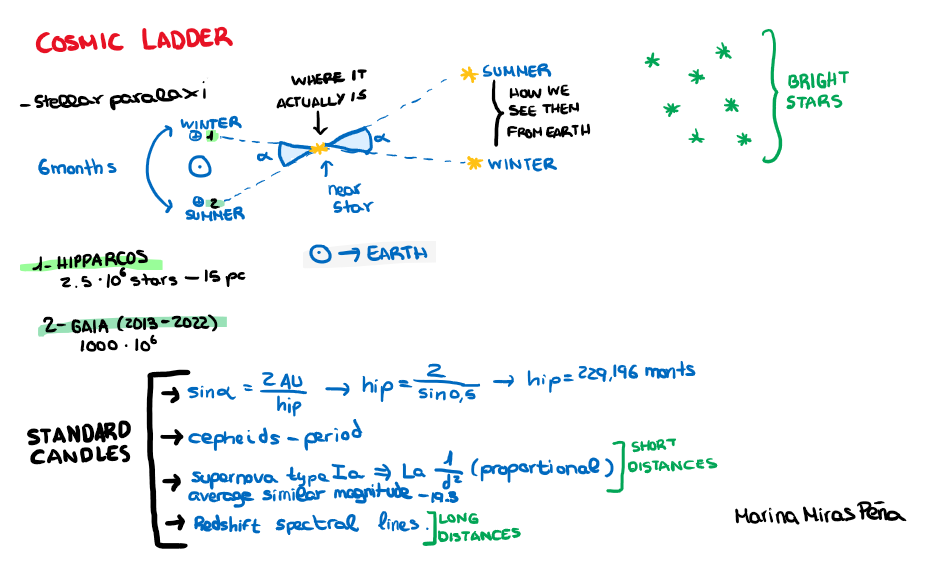
Regarding the Cepheids, we learnt how scientifics realised that one star can be further than other even though they had different brightnesses. It's called the Cosmic ladder.
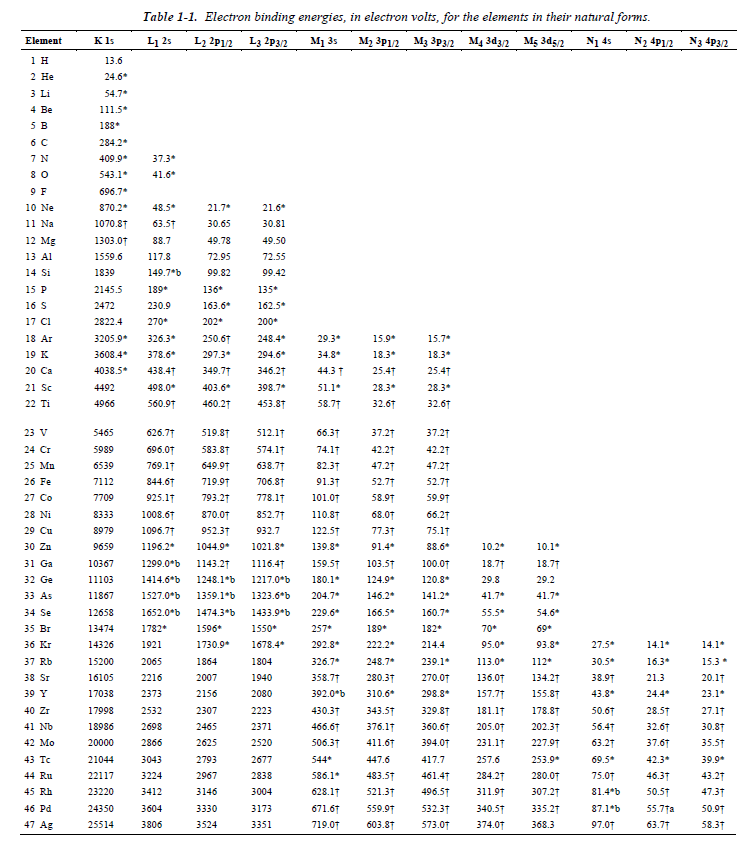
I've used this table, which was given to me during the lessons. It's not possible for me to know its provenance, so I've inserted below so it can be used without any problems. To mention it, we'll call it the Table 1-1.
13. THE TEACHER'S WEB
Here I could know how to carry out this project, all the steps I had to do and how to do them. Thanks to my teacher's web I've been able to perform this project.
14. WORD
I've been using a parallel word document with all the main information about the proyect (images, calculations, links, screenshots, etc.) so that, in case I lost all my work, I wouldn't have to start from the begining.
15. GOOGLE SCHOLAR
This section of Google is where I searched for almost all the information I have.